Plant-assisted remediation of nitrogen fertilizer contaminated soil and groundwater at an industrial plant site
Exploratory Graphics
Change in ammonium nitrate levels for all treatments in the first growth chamber study is illustrated in Figure 2. Each plant type is presented in a separate box plot, which allows for a visual check for normality of the data and for outliers. Figure 3 presents the change in ammonium nitrate concentrations based on treatment. Upon visual inspection of the plots generated from the Trial 1 data, it is evident that there is a change in soil ammonium nitrate concentrations from pre to post remediation in all vegetation types. It is assumed that any extreme values are due to the unsuccessful growth of individual plants. There is little change in the ammonium nitrate concentrations in the control pots for all species as was expected. As illustrated in both Figures 2 and 3, only the Saltlander grass has shown successful removal of ammonium nitrate in soils with initial concentrations of 4000 ppm.
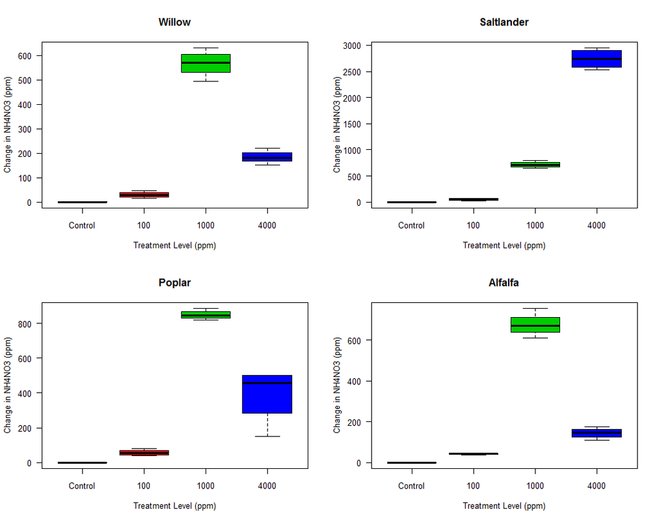
Figure 2. Change in soil ammonium nitrate (NH4NO3) concentration at each soil treatment level for
each of four plant types in tree pots following 90 days of plant-assisted remediation in
growth chamber. Measurements are in parts per million (ppm).
each of four plant types in tree pots following 90 days of plant-assisted remediation in
growth chamber. Measurements are in parts per million (ppm).
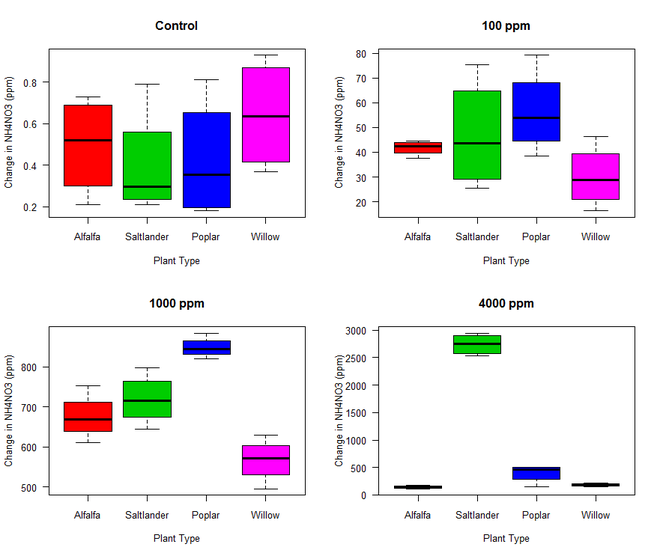
Figure 3. Change in soil ammonium nitrate (NH4NO3) concentration for each plant type in each of four
treatment levels in tree pots following 90 days of plant-assisted remediation in growth
chamber. Measurements are in parts per million (ppm).
treatment levels in tree pots following 90 days of plant-assisted remediation in growth
chamber. Measurements are in parts per million (ppm).
