Plant-assisted remediation of nitrogen fertilizer contaminated soil and groundwater at an industrial plant site
METHODOLOGY
Preliminary Sampling
Groundwater samples were taken in Spring 2010 from 13 wells within and surrounding the nitrate landfill to determine the extent of groundwater contamination. An electromagnetic (EM) survey was completed around the landfill site and directly adjacent to the river to measure electrical conductivity, which aided in delineation of the contaminant plume. Soil cores from within and adjacent to the landfill were taken with a Geoprobe drilling rig and the samples were sent to an analytical lab for analysis.
Growth Chamber Trial #1
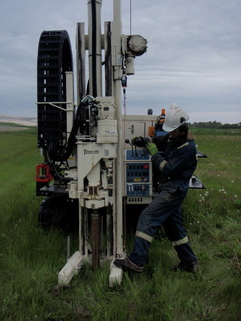
Growth chambers set to mimic the natural environment at the Agrium site were used during the study. Ammonium nitrate was added to clean soil in tree pots at three concentrations to create four treatments including a control. Treatment levels included 100, 1000 and 4000 ppm of ammonium nitrate. Willow and Okanese poplar cuttings were planted and alfalfa and Saltlander seed applied using a broadcast seeding method. A total of 48 pots were planted with three reps of each plant type - contaminant level combination. Pots were placed randomly throughout the growth chamber.
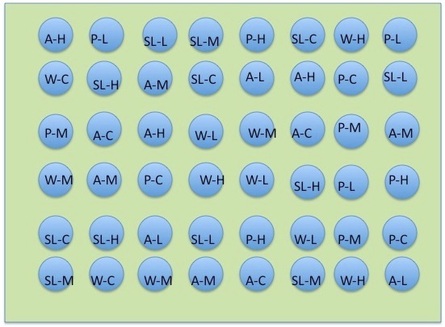
A - Alfalfa
P - Okanese poplar
W - Willow
SL - Saltlander grass
H - 4000 ppm
M - 1000 ppm
L - 100 ppm
C - control (clean)
Figure 1. Growth chamber layout for Trial 1 of plant-assisted remediation study.
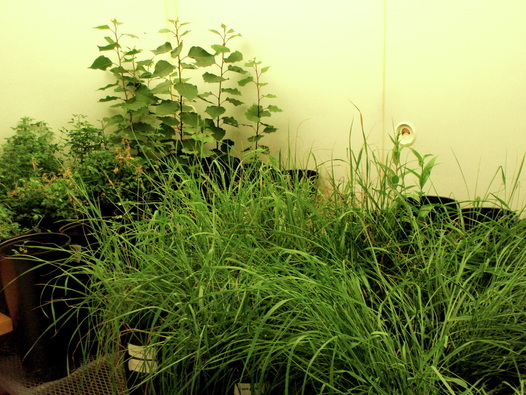
Trial 1 was run for 90 days, similar to an average growing season for the Agrium area. Upon completion, plants were harvested and soil sent to analytical lab for analysis. Electrical conductivity, nitrate, ammonium and pH were measured and compared to pre trial concentrations.Plant above and below ground biomass was observed as further indication of successful plant growth in each of the soil treatments.
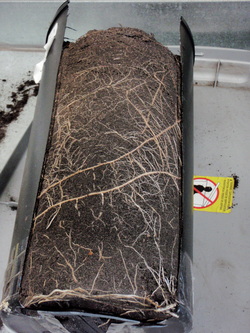
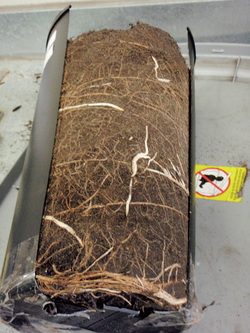
Willow roots, post trial - 1000 ppm
Willow roots, post trial - Control
Data
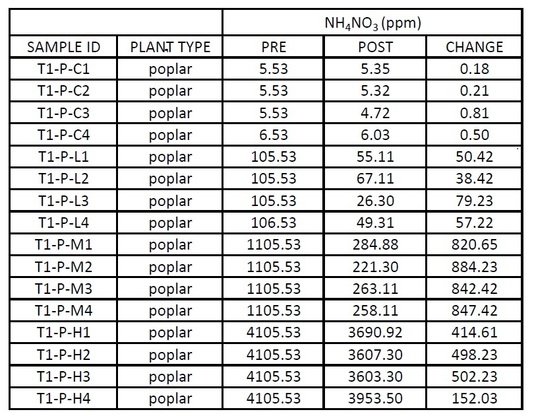
Table 1. Sample of raw data from Trial 1 of plant-assisted remediation growth chamber
study.
study.
Sampling units in this experiment are individual tree pots, specified according to trial number, plant type and treatment level. Predictor variables include starting ammonium nitrate concentration which is a continuous and manipulated for the experiment, and plant type, which is categorical.
Statistical Analysis
Raw data was visually checked for normality by examination of boxplots illustrating change in ammonium nitrate concentration in all plant types and treatment levels. An Analysis of Variance (ANOVA) was completed for each plant type to determine the effect of each treatment level. A Tukey test was then used to complete a pairwise comparison to determine which treatment levels were significant.
